Ecommerce and Retail

Ecommerce stores spend a great deal of time gathering customer data and analyzing buyer behavior. In the quest for new and repeat customers, online stores should not lose sight of the importance of product data and analytics.
Product analytics transforms data into insights that store owners can use to optimize product performance and profit margins. Analyzing product data also enables ecommerce stores to make predictions about buying trends and inventory.
The following strategies can help you better analyze your product data for improved performance and a healthier bottom line.
Most online retailers have a good idea of which products are their best sellers and which don’t perform as well.
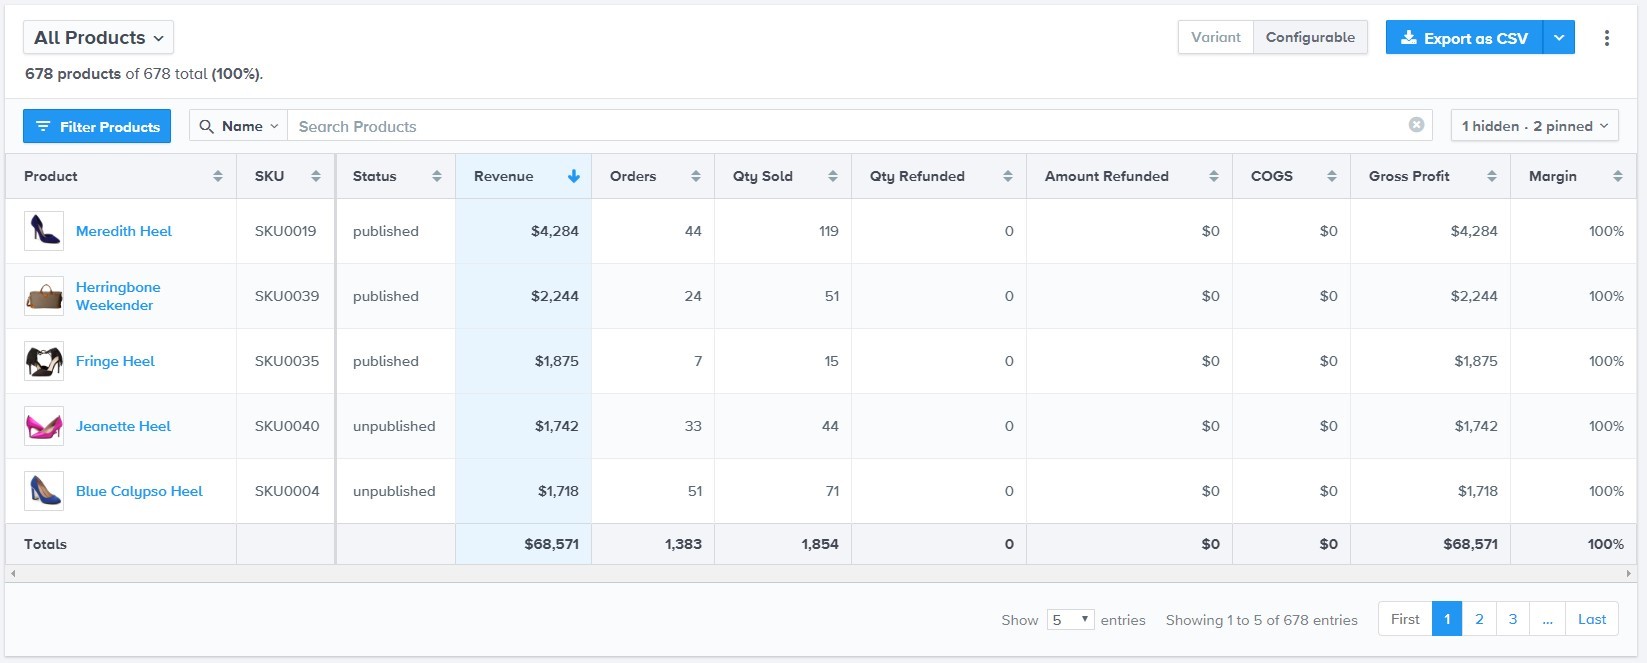
For insight you can act upon, take the next step and create a ‘Top Products’ list, which will enable you to focus solely on your top performers in order to improve their profitability.
Products that make the list should include highest number sold as well as merchandise with the highest gross profit and sales margins.
How to benefit from Top Product insight:

By measuring product analytics, you can develop reports that enable you to make better product, sales and marketing decisions.
For example, a weekly report on ‘Top Products Bundled’ can be used to determine which bundled products should be featured together on a prominent space on your website.
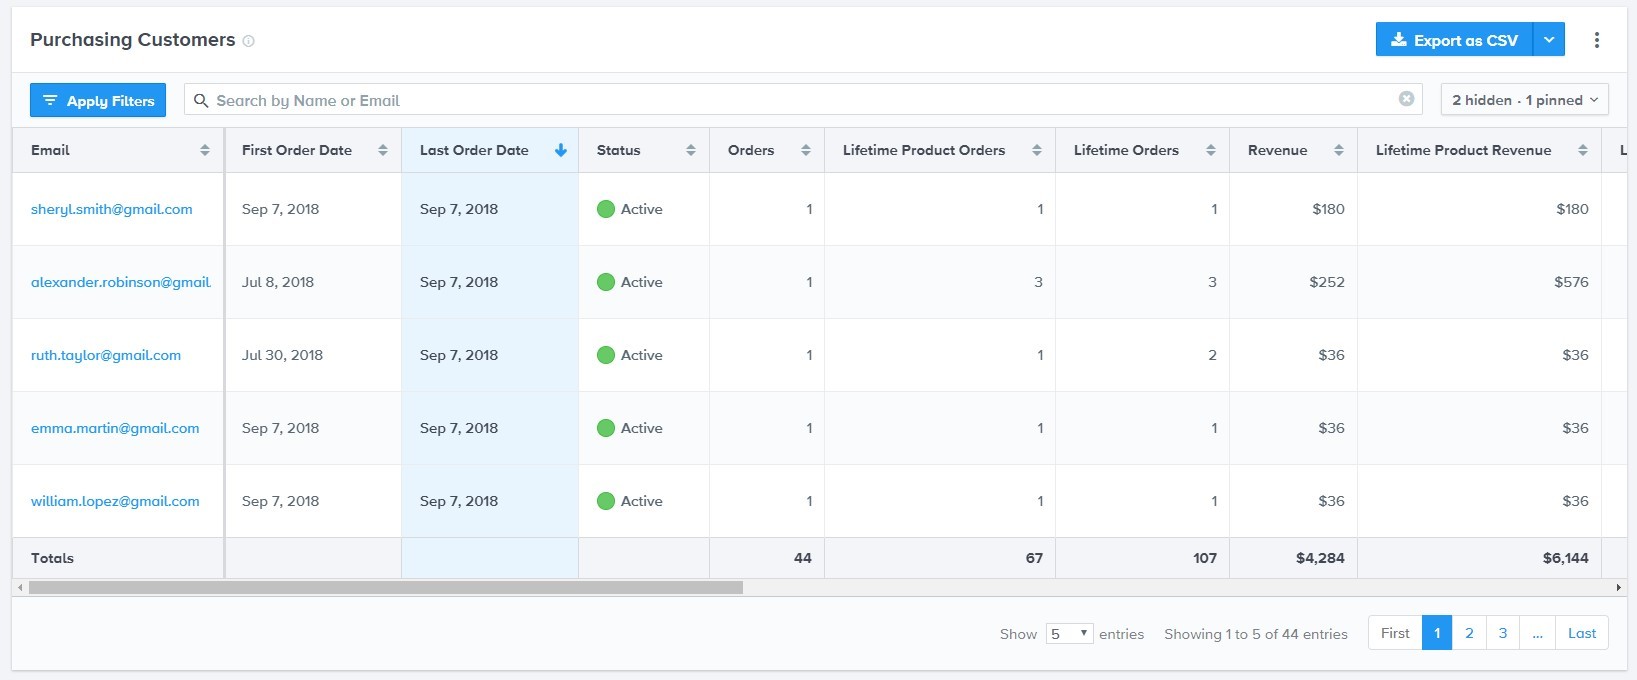
With Neto Analytics Studio, you can also review your top performing products and export the “Customers who have purchased” table on top performing products.

With that list, you can send an email campaign featuring products that are “often bundled with this product.”

| Related Reading: Using a Data-Driven Approach to Fuel Your Marketing Strategy
Use segmentation for key product identifiers such as Most Profitable Products, Most Refunded Products or Nearly Out of Stock Products.
Neto Analytics Studio’s Product Analytics feature provides insight into product segments, such as most profitable products or best bundles. Users can also drill down to Individual Product Pages to learn more about what’s helping or hurting store performance.
You can analyze and understand product categories all the way down to individual products in order to optimize sales and growth opportunities. Gain granular level insight into more than 20 categories, including:
Starting with Tip #1, review your top products. Using Neto Analytics Studio, you can then gain insight into which products are most often bundled with your top sellers.
On an individual product level view, you can see merchandise most often bundled with each product as well as who purchased the individual product. Take the ‘Customers Who Purchased’ list and use it for a campaign to cross-sell popular bundled products.
In this example, we drilled down to the product page for the Cotton Candy Camera Bag. In addition to metrics such as Revenue, COGS and Gross Profit, you can see a lists of items “Often Bundled with this Product”. Use that information in an email campaign to the next data set, “Customers Who Have Purchased”. Just like that, you have a targeted campaign for buyers with a high likelihood of buying related products.

Keen to learn more about how analytics can help your business? Watch our Neto Analytics webinar, or read on with Make Better Decisions With Data: Neto Analytics Studio or the Top 10 Ecommerce Analytics Reports to Run in Neto Analytics Studio (and How Often to Run Them).